Microsoft Intune includes built-in logs that provide information about your environment. You can view these logs in various ways, but to me, the easiest way is to send the Intune logs to Log Analytics. Once there, you can create nice visualizations and set alerts on the collected log data.
Tip: In addition to sending logs to Log Analytics, you can archive the logs in an Azure storage account or stream them to an Azure event hub so that the data can be consumed by your favorite SIEM tool.
Before getting started, you’re probably wondering what kinds of data Intune logs that we can view using this method. Wonder no more:
- Audit Logs show details on different events or tasks that happen in Intune.
- Operational Logs show details on users and devices that successfully (or unsuccessfully) enroll.
- Device Compliance Organizational Logs provide information about device compliance in Intune, and details on non-compliant devices.
Next, make sure you’ve got all the prerequisites covered:
- An Azure subscription. If you don’t have one, grab a trial.
- An Intune environment (preferably with some managed devices). If you don’t have one, get a trial.
- An Azure Log Analytics workspace to send logs to. If you don’t have one, go make one.
- Global Administrator or Intune Service Administrator permissions. See above.
Let’s get started.
Enable Intune Diagnostics
Before you can query log data, it makes sense that the log data needs to be available to Log Analytics right? So, you first need to tell Intune where to stick it’s log data. You do that by enabling Intune diagnostics.
- Sign in to the Azure portal and go to Intune.
- Under Monitoring, select Diagnostics settings. The first time you open it, turn it on. Otherwise, add a setting:
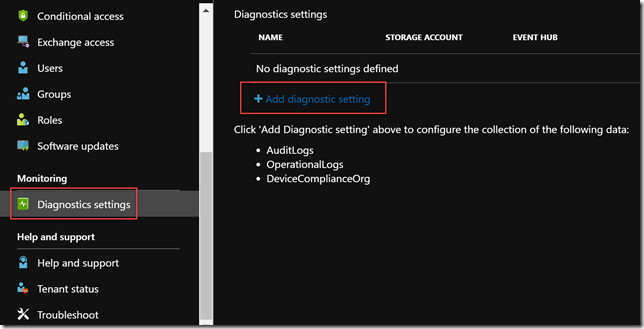
- Give the new diagnostic settings a name, select Send to Log Analytics, and then scroll down.
- Select your Azure subscription, the name of the Log Analytics workspace you want to send Intune logs to, and all the available Intune log options. After you’re satisfied that it’s all correctly configured, click Save.
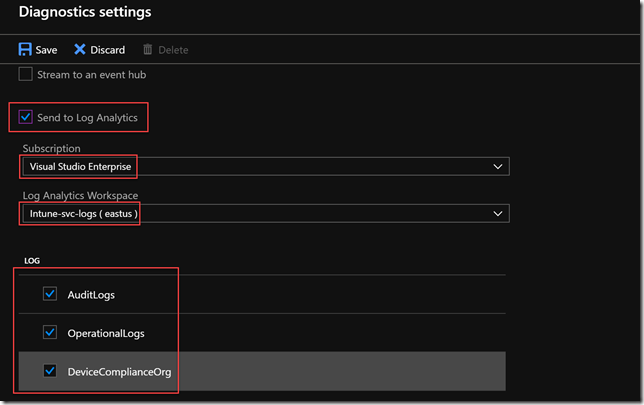
- Hit Refresh back on the Diagnostic settings screen and you should now see the newly created diagnostics settings pointing to your Log Analytics workspace.
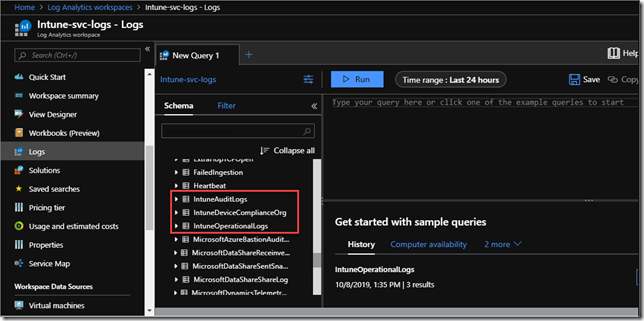
- To see the logs in the Log Analytics workspace, sign into the Azure portal, select Log Analytics workspaces and then select the workspace containing Intune diagnostics that you just set up.
- Under General, select Logs, and then scroll down the list of logs until you see the Intune related ones. Here’s what it should look like:
- If you want to get a sneak peak into the logs, just hover over the log name and click the eye icon. That will do a quick query of the log for you after you click Run from the new query window:
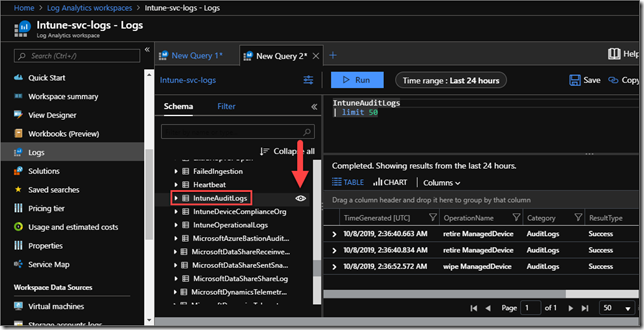
Tip: Intune log data is flowing into the Log Analytics workspace now. It wasn’t before, so don’t be discouraged if you don’t see anything yet. Also, remember that all queries start from now as no historical data has been sent to log analytics.
Create Log Analytics dashboards
Now that Intune log data is being made available to query with Log Analytics, we can make some interesting visualizations and even alerts based on the data. You’re only limited by your imagination and depth of Kusto querying abilities. In the interest of keeping this blog post shorter than War and Peace, and also due to my limited Kusto Query-Fu skills, that means we’re going to be making some pretty basic, but useful dashboards.
I’ll show you how to create sample dashboards for monitoring Intune device enrollment and administrative operations. Once you have the general idea, you’ll be able to create other dashboards based on your own queries as your needs dictate.
Create the device enrollment dashboard
Let’s create a dashboard that shows the number of successful device enrollments by OS type and the number of unsuccessful device enrollments—and why they failed. That’ll help you troubleshoot where things might be going a little catawampus so you can take proactive action.
- Log into the Azure portal and navigate to your Log Analytics workspace. Click on View Designer:
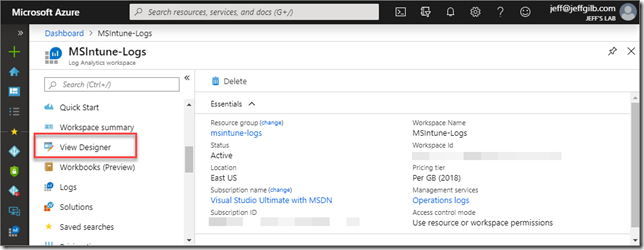
- You should see something like this below.
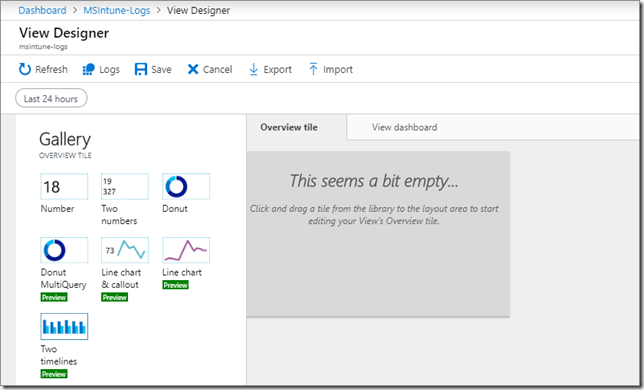
- While on the Overview tile tab, click to select Two numbers (at the top middle) gallery item and then, in the item properties at the right, give the new tile a name like Device Enrollment.
- Put in Successful Device Enrollments for the First Tile legend. In the search Query text box, delete the default query and replace it with this (all one line):
IntuneOperationalLogs | where OperationName == “Enrollment” and Result == “Success” | summarize count(Result) - Set the legend value of the Second Tile to Unsuccessful Device Enrollments and replace the default query with:
IntuneOperationalLogs | where OperationName == “Enrollment” and Result == “Fail” | summarize count(Result) - Click Apply, but don’t save yet. You’ve made the Overview tile, but still need to set up the dashboard views. That’s what you get as a click-through from the Overview tile. You’ll see what I mean in a minute. For now, click View dashboard.
- Click to add Donut & list from the available gallery items and give the Group Title a nice name. Something like Successful device enrollments.
- Scroll down and replace the default header title with Device enrollment by OS.
- A little further down, replace the default Donut query with this:
IntuneOperationalLogs | where OperationName == “Enrollment” and Result == “Success” | extend propertiesJson = todynamic(Properties) | extend OsType = tostring(propertiesJson [“Os”]) | project OsType | summarize count() by OsType - Continue scrolling down down the Donut & List item properties until you get to the List section. Replace the default list query with:
IntuneOperationalLogs | where OperationName == “Enrollment” and Result == “Success” | extend propertiesJson = todynamic(Properties) | extend OsType = tostring(propertiesJson [“Os”]) | extend OsVersion = tostring(propertiesJson [“OsVersion”]) | project OsType, OsVersion | sort by OsType asc - In the column titles section, enter Device for the Name field and then click Apply. Finally, click Save at the top of the View Designer. You should see a tile (your data will vary) that looks something like this on the workspace Overview now:
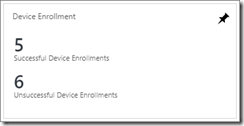
- Clicking the Overview tile drills you down to the dashboard view we just made. Again, your data will vary.
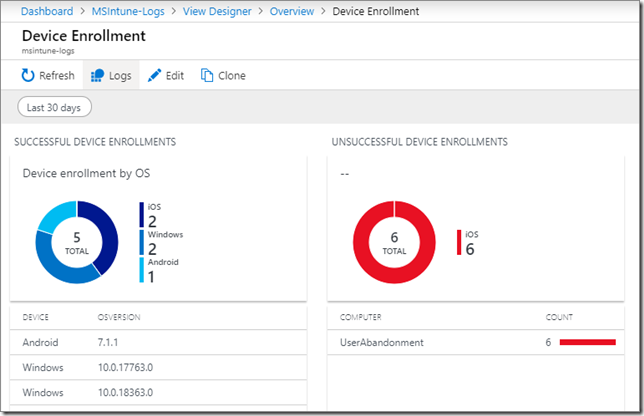
Create the Intune Administration dashboard
Instead of device enrollment, this dashboard will focus on monitoring Intune administrator actions. It’s basically the same process with different queries.
- Log into the Azure portal and navigate to your Log Analytics workspace. Click on View Designer.
- This time, instead of Two numbers, click on Donut. Give it a name like Intune Administration and use this for the donut query:
IntuneAuditLogs |summarize Auditevents = count() by OperationName | sort by Auditevents - Hit Apply and then select the View dashboard tab.
- Select Two timelines & list from the available gallery items.
- Give it a name in the Group Title box like Intune Admin Operations and then use this query for the First Chart query value:
IntuneAuditLogs |summarize Auditevents = count() by OperationName - Scroll down to the Second Chart value and delete the default query. We don’t need this one.
- Next down, use this for the List query:
IntuneAuditLogs |summarize Auditevents = count() by OperationName - Finally, use this for the Navigation query value at the very bottom:
search {selected item} | project OperationName, TimeGenerated, Identity | sort by TimeGenerated desc - Click Apply and then Save the view. Now you should see a second overview tile showing you the admin operations retrieved from the Intune log files. You can also get directly here from the Azure portal by going to Log Analytics, selecting your workspace and then Workspace summary under General:

- Clicking on the Intune Administration overview tile will bring you to the dashboard view looking something like this:
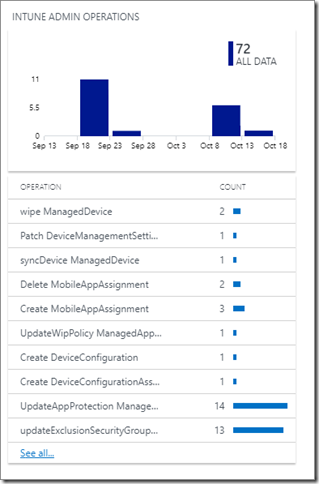
- You know you’re curious, go ahead and click on one of those operation names. That’ll trigger the navigation query you entered. The results let you know who performed the operation. In this case, it looks like I’m busted wiping a device:
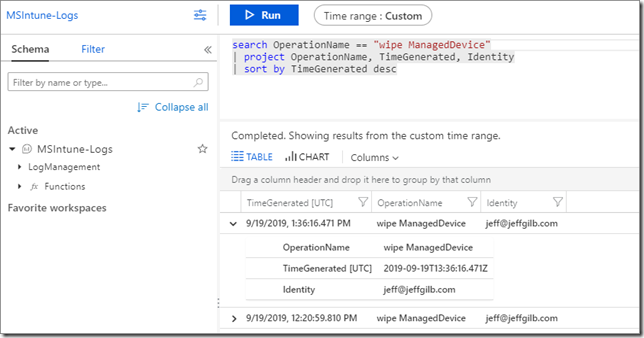
Tip: Wiping a device can be a serious event so you might want to be alerted when that happens. Creating alerts when interesting things happen is pretty easy to do. For example, to create an alert for when a device has been wiped, use this query:
IntuneAuditLogs
| where OperationName == “wipe ManagedDevice”
Summary
And that’s the end of this blog post, but probably just the beginning of your Intune log querying adventures. I’ll leave you with a few parting tidbits of information to help you on your way:
- Before you enable Intune diagnostics, there will be no log data to query.
- The default retention period for Log Analytics data storage is about a month. You can change the data retention period to be as long as two years. You’ll pay per GB of logs ingested and stored.
- If you don’t want to lose your log data after the time period set for Log Analytics data retention, write the logs to an Azure storage account as well as to Log Analytics.
- The default time period used in query results is 24 hours. You can change that to see older information by time range. You can go from the last 30 minutes all the way out to a custom date far in the past—at least up to your retention period anyway.
- If you pin an overview tile to your Azure portal dashboard, it will default to only showing data from the last 24 hours. You have to click the tile and then change the query date from the dashboard view.
- Log Analytics is queried by using the Kusto query language. Brush up on that to create more complicated queries.
- Still have questions? Here’s the docs: https://docs.microsoft.com/azure/azure-monitor/overview.
![]()